Category Archives: JavaScript

Simple CesiumJS Skydive Sim

skydive

Note: updated version with guidance lights here.

On July 30, 2016, a man named Luke Aikins went skydiving, without a parachute, and landed safely in a net. I was curious what that would feel like, so I made this simple skydiving simulation using CesiumJS.

You can track using W, A, S, D to feel how much control you could possibly have on the descent.

The simulation parameters are as follows:

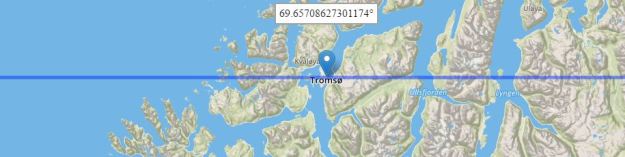
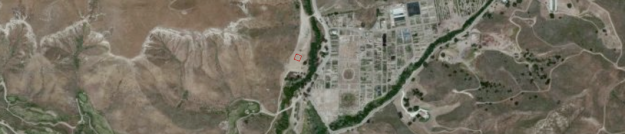
  • the location is similar to the event, but I’m not exactly sure where it took place. Apparently, it was at the Big Sky movie ranch, near Simi Valley, CA. This is the nearest open area to where Google Maps tells me that is.
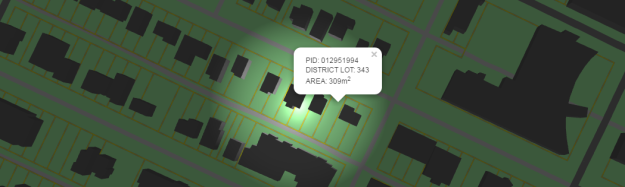
  • the red target on the ground is 30m x 30m, same as at the event
  • the simulation starts at 7620m (or 25,000 feet), same as at the event
  • you fall at 53.6448 meters/second, which is 120mph, which is at the slower end of the velocity range a human would travel during free fall. I figure he was trying to go as slow as possible, but there’s only so much you can do to make that happen!
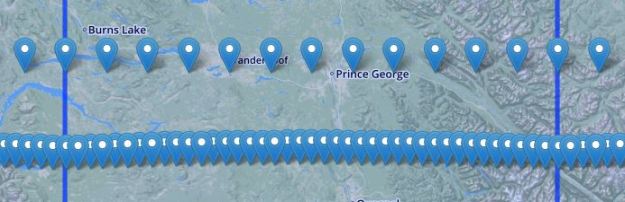
  • I was surprised to learn (simultaneously from both @tkw954 and @erikfriesen – thanks!) that a good skydiver can track at 45 degrees (1:1 glide ratio), which made the math for horizontal movement super-simple – it equals the fall rate.

I stole borrowed most of the animation/control code from the Cesium Camera Tutorial.

The simulation ends in blackness, which is because I was too lazy to make a net, however with no net, that seems fitting. Have fun!

edit (08/06/16): this post was featured on Maps Mania!

edit (08/09/16): added guidance lights to this example. This is likely not how the actual light guidance system worked. In my example, the farther you’re aimed from each corner (up to 100m), the more red the circle turns. The closer you’re aimed to each corner, the more green it turns. It would be more useful to code the lights to indicate in which direction to correct, but I only have so much time.

edit (09/01/16): this post was mentioned in the Cesium Blog!

edit (12/29/16): this post was mentioned in the Exploratorium Blog!

Basic Mapzen/Tangram test

pg_mapzen

Over the past few days, I’ve jumped into the Mapzen/Tangram ecosystem. First impressions: somewhat steep learning curve to grasp YAML format, lighting options are pretty neat, very fast to render GeoJSON, documentation is good although asks a lot of the newbie reader, the provided Mapzen Vector Tile Service (mostly OSM) is awesome, and I bet shaders are cool, but I don’t understand them (yet).

My example is largely based off the Mapzen JS Walkthrough, with a few simple additional wrinkles. I draw parcel geometry and attribute data directly from Open Data Prince George. I take building data from the same source, remove OSM buildings from the scene, and draw/extrude 3D buildings based on the building height attribute.

Antipodes (MapboxGL)

antipodes

In 2013, I made an interactive antipode map (points on opposite sides of the Earth) using the Google Maps API. As I’m trying to make the leap from Google Maps/Mapbox JS to Mapbox GL JShere is my rehash of the same map. The only tangible difference between these two maps is that you can rotate this version (right-click and drag).

Some issues I have yet to solve:

  • I can’t seem to get the rotated maps’ labels to display correctly (i.e. right-side up and left to right). I would need to somehow change them to be rendered as a mirror image.
  • The second set of maps don’t render at all in Chrome, although they do while testing locally. This entire project seems to work in IE and Firefox. edit: this project now seems to work in Chrome.

– this map was featured on Google Maps Mania! http://googlemapsmania.blogspot.ca/2016/07/the-antipodes-maps.html


Draggable Latitude Line Map

latline

I just returned home from a trip to Scandinavia (Denmark/Sweden/Norway), and was curious to see how far north I’d gone. I made it as far as Tromsø, which is at about 69.7°N, but where would that latitude place me in North America? It turns out, pretty far north – about halfway up Baffin Island. See for yourself on this quick map (drag the marker to move the line north and south, then see where in the world passes through that latitude).

Old Prince George Floodplain Map

flood

Just thought I’d share a cool looking old map overlay I found digging through the BC Map Services. I enjoy the very detailed, yet simple look. I’ve also superimposed the City of Prince George Flood Plain 1997 layer, which I think is the digitized version of the scanned BC map. Kinda scary to see how far up Patricia/Winnipeg/17th/Massey it would flood, but I guess the City’s got it figured out.

UrtheCast Satellites

urthecast

I’m working my way through the UrtheCast API documentation, and got side-tracked into making a satellite tracker map. This map shows the ten most recent locations of four satellites (ISS, Deimos-1, Deimos-2, and Lansat-8) and their imagery swaths, I think. The reason I say I think is that the call for the imagery swaths (or the forecast) is set for the future, although the returned timestamps appear to be in the past.

I also think I figured out how to hide my UrtheCast api key and secret from prying eyes through a PHP proxy, but I could also be wrong about that! If you can see them, let me know. 🙂

WMS GetFeatureInfo Request

geomet_getfeatureinfo

Continuing on with yesterday’s exploration into GeoMet and its myriad web mapping services (WMS), today I added GetFeatureInfo requests (map here).

If you’ve used WMS, you’re probably familiar with GetCapabilities (retrieves metadata) and GetMap (retrieves map tiles) requests. GetFeatureInfo is another type of request which retrieves attribute information at a given location, provided the server (e.g. GeoMet) has been configured to provide this information (look for “queryable=’1′ ” in the layer metadata).

One stumbling block I encountered (and likely handled poorly) was overcoming the issue of cross-origin resource sharing (CORS). No matter what I tried, I was blocked from retrieving the request response because, of course, my webpage resides on a different server than the WMS. I got around this by calling a PHP script that copies the text response from the request locally and reads that version. Honestly, I’m not sure why that works and reading the original request doesn’t, but it does and that’s good enough for me. If you have a simpler solution (I’m sure it’s out there), I’d love to learn about it!

GeoMet: Canadian Weather WMS

geomet

I’ve been looking into Canadian open data, and stumbled across GeoMet Geospatial Web Services, which is a HUGE collection of weather-based web map services and KMLs. You can check out my sample map here, which contains a very tiny sampling of the available WMSes.