 I’ve been thinking a lot recently about how to visualize NIR (Near Infrared) photography, and here’s where I’m at.
In brief, NIR photos (combined with a regular visual light photo) allow us to calculate an index of plant health, or more technically, the ratio of absorbed photosynthetically available radiation. Healthy plants reflect almost all infrared radiation and absorb a high percentage of visually red radiation – this is why healthy plants appear green (they absorb red and blue and reflect green light).
The most often used formula for interpreting NIR photos is NDVI (Normalized Difference Vegetation Index). NDVI values range from -1 to +1. I calculated NDVI in ArcGIS, exporting to 8-bit unsigned PNG format (in retrospect, I should have exported to a higher bit value in order to retain the original NDVI values), which resulted in values ranging from 0 – 255.
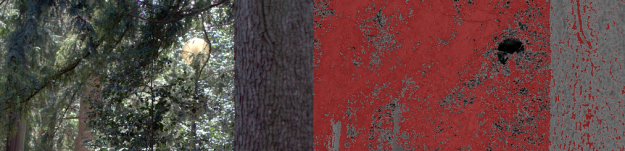
The end objective was to calculate percent coverage of vegetation in photographs, whether healthy or not. My preliminary website seems to do an adequate job, although it surely needs refinement. The jQuery UI slider controls which pixels to mask as “vegetation.” The HTML5 Canvas elements take care of the rest, manipulating the NDVI image at the pixel level, coloring those above the threshold level (set in the slider) red.
Original NIR and RGB images found here: Image and Visual Representation Group
